

One of the biggest benefits of mind mapping software is that it’s a big creativity booster. Here are 12 ways it can supercharge your muse.
How to build a professional-looking infographic in Venngage
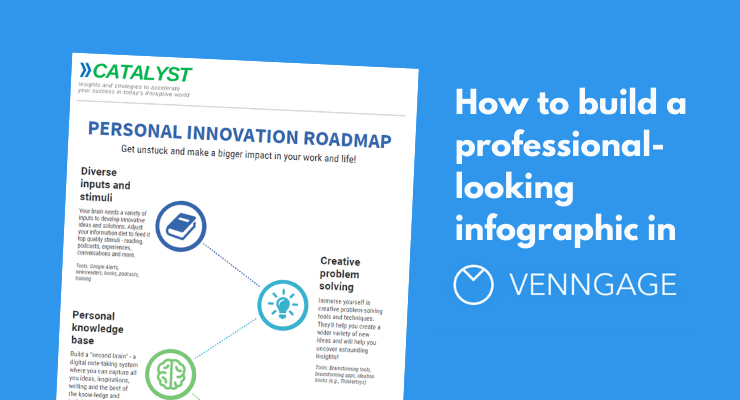
Venngage has become my go-to tool for creating infographics. Why? Because of its excellent templates, the perfect starting point for my ideas
12 business benefits of visual thinking [INFOGRAPHIC]

In today’s environment, businesses are facing more complex challenges than ever. Visual thinking tools are emerging as one of the most powerful ways to analyze, brainstorm and organize your thinking to help you tackle them. For those of you who are just starting your visual thinking journey, my new infographic summarizes 12 potent business benefits […]
More than mind mapping [INFOGRAPHIC]
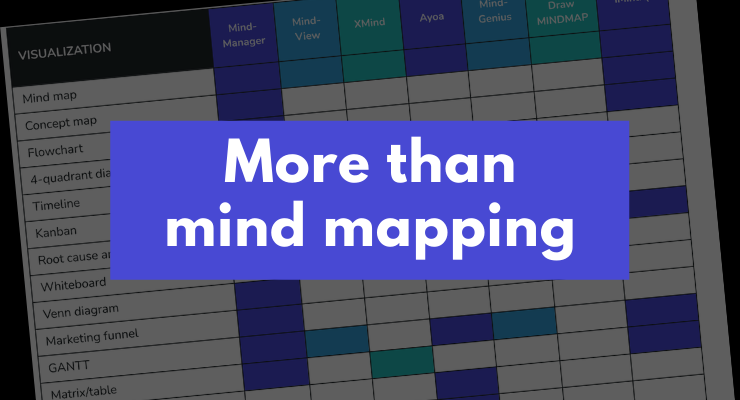
For years, mind mapping software developers have been gradually adding the ability to create more types of diagrams to their applications. I’ve mapped out 7 popular programs and the 16 types of diagrams they support in a new infographic. It started with GANTT charts and concept mapping and grew to include things like diagramming, four-quadrant […]
How to build an interactive visual CV in Visme
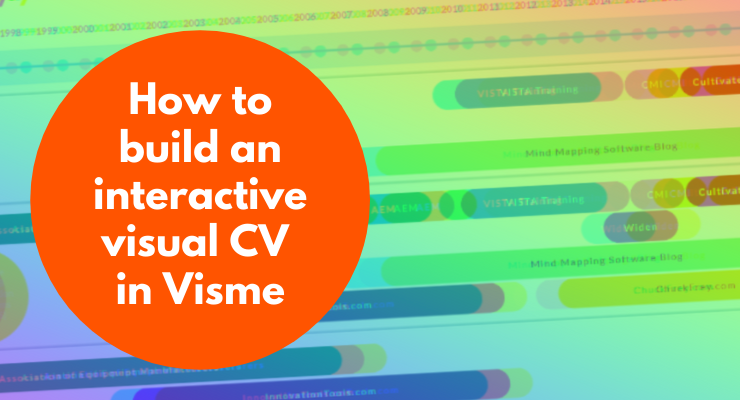
Interactive infographics can command attention and compel engagement. Here’s how to create an interactive visual CV using the graphics tool, Visme.
ConceptDraw DIAGRAM 12 surprises with its versatility, customizability
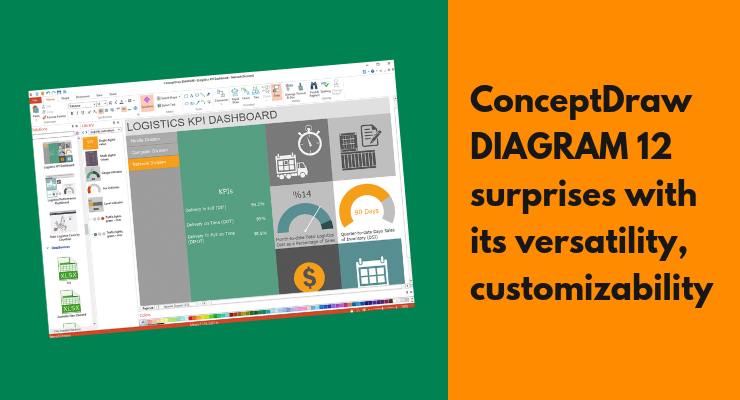
ConceptDraw DIAGRAM 12 is without a doubt the most powerful, comprehensive diagramming program I have ever seen. Descended from the ConceptDraw vector illustration program, it boasts some unique capabilities that are worth a deeper look.
Visme launches Make Information Beautiful graphic design video series
Payman Taei, the founder of Visme, is the host of a new video series called Make Information Beautiful that aims to educate the average user on the principles of effective design.
Corel CEO outlines an expanded future for MindManager

Corel CEO Patrick Nichols sees a bright future ahead for MindManager, which it acquired from Spigit/Mindjet on August 8, 2016. Its future may be as a platform for mind maps and other forms of visualizing of structured information.
Visme: The Swiss Army Knife of visual communication
Visme is a powerful web-based graphics creation tool that is perfect for designing and publishing high-impact slides, charts and infographics, as well as animated graphics. Soon, it will also enable you to create reports, web content, product presentations and wireframe diagrams. Visme is literally the Swiss Army Knife of visual communication. In this detailed review, we take a closer look at its capabilities and how you can use them in a business setting.
Infographic: 14 best practices for advanced mind maps
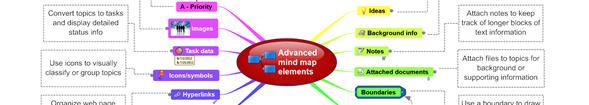
This new infographic summarizes 14 best practices for utilizing the advanced capabilities of mind mapping software.