iMindQ is a new visual thinking program from Seavus that combines organic mind maps, concept maps, whiteboard space, flowcharts and project planning in a single, easy-to-use program. It gives you more ways to visualize your ideas and information in a single, affordable package.
iMindQ is the successor to DropMind, a program that Seavus launched several years ago as a web-based application but soon expanded into desktop and mobile versions. In this review, we’ll take a closer look at what’s most notable and useful for business users.
The iMindQ user interface
When you first open iMindQ, you’re greeted by an expansive user interface that provides plenty of room to map out your thinking. A ribbon toolbar above the work area remains minimized until you click on one of the tabs. It then expands to show all of the commands it contains, and minimizes when you click anywhere in the work area. This arrangement lends iMindQ a very clean, uncluttered look. If you want to display the toolbar open all the time, you can turn off this collapsible functionality in the program’s quick access toolbar (just above the ribbon).
The program contains tabs entitled Home, Insert, Format, View, Present, Exchange and Plan. All are intuitive and contain commands centered around specific common tasks you can perform in iMindQ. The one exception is Exchange. Is it named after Microsoft’s popular e-mail server? Does it enable iMindQ to exchange data with other business applications? When you click on it, you discover it’s the latter – it contains commands to import and export data with Microsoft Office applications, plus connecting to your iMindQ web account.
This is a minor complaint, however. For the most part, iMindQ’s ribbon toolbars are logically organized and easy to understand.
The right side of the workspace contains tabs for map parts, task information, style, library, notes and browser. When clicked, the tabs expand into vertical panes – very similar to other programs and very intuitive for first time users.
Types of diagrams supported
One of the central aspects of iMindQ that Seavus has been promoting is the fact that it goes beyond mind mapping. You can use this program to create:
- Mind maps
- Organic mind maps
- White boards (which includes flow charts, concept maps and other types of diagrams)
- WBS charts (for project management)
- Organizational charts
Creating a mind map in iMindQ
 iMindQ provides you with multiple ways to add new topics to your mind map:
- Via the ribbon toolbar
- By right-clicking a topic
- Using the INS key on your computer’s keyboard (de facto functionality for most mind mapping programs these days)
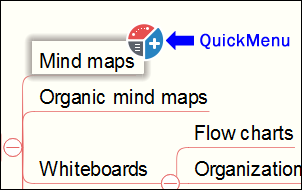
- Using a pop-up “quick menu”
Quick menu is a colorful, circular toolbar that pops up when you hover your mouse over the upper right corner of an existing topic. It enables you to drag and drop to create a new sibling topic, style the current topic or draw a relationship line between the currently-selected topic and another one within your mind map. I’m always a fan of being able to perform common tasks without making repeated trips to the toolbar.
Formatting your mind map
The program gives excellent visual feedback as you move topics around; a red line appears where it will “land” if you release the mouse button. Clicking on the blue section of the topic’s quick menu gives you fast access to its properties. There, you can adjust topic shape, fill, color and transparency, adjust line and border color and size, plus change the topic text, image and icon alignment. I tried this with an icon and was satisfies with how easy it was to move it to any one of four positions – no dragging and dropping, just a simple selection from the topic properties dialog box.
In addition, you can also select an image to replace the topic shape with it. I tried this, but was disappointed to discover that it only works with scalable vector graphic (SVG) images – no support for PNG, GIF or JPG, the formats in which the majority of my images are stored. One plus side – if you do replace a topic shape with an SVG graphic, you can immediately apply it to all topics that share that shape – nice!
iMindQ ships with a library of map styles, which you can quickly apply to your mind maps to adjust their color scheme and background color. You can also save your own styles for re-use – nice! One command that I noticed when I was playing around with map styles was something called “spectral ties.” When I tried it on my mind map, it changed the connector lines into a set of rainbow colors. It didn’t do the same for the first-level topics, which would have been nice. So I adjusted the topic colors to roughly match the “spectral” colors of my map connectors. This was a trial and error process. It would be nice if this style changed the topic connector lines to colors that are part of iMindQ’s standard color palette, but that’s not the case in this 1.0 version.
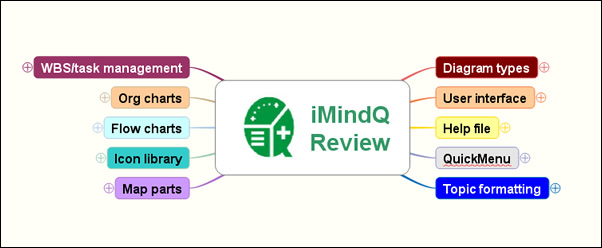
One other thing I appreciated as I was getting ready to output my mind map as an image for this blog post is that iMindQ automatically aligned the first-level topics just the way I like them: Those on the left side of the central topic were right-aligned to each other, and vice versa. As you can see, this results in a neat, well-organized mind map. With other programs, I need to either manually position first-level topics to look like this, or use a topic align command – both of which are somewhat time-consuming. I’m glad to see that iMindQ did this task for me!
I’m impressed with the high level of control iMindQ offers to adjust topic properties.
Map parts offer a lot of flexibility
Map parts, as their name implies, are small collections of topics and subtopics that you can easily drop into the mind map you’re currently working on. The 9 map parts that ship with iMindQ include days of the week, idea evaluation, the marketing mix “4 Ps” and smart goals. Selecting one reveals a drop-down box, which gives you options to add the map part to your current mind map, modify it (which opens it as a new mind map), delete it or rename it.
At the bottom of the map parts pane is a text link entitled “Add selected topics.” This leads to a dialog box that enables you to save branches of your mind maps as re-usable map parts – a real time-saver! I played around with this feature of iMindQ, and found it very easy to create my own map parts, which were immediately added to the bottom of the list of parts. Taken together, the functionality of this panel means you can delete the standard map parts that you don’t think you’ll ever use and populate it with the ones you need to increase your productivity.
Just one minor complaint: The map parts don’t display names anywhere and the thumbnail images of them are too small to read the text they contain. Curiously, you can rename map parts, but the names you give them don’t appear anywhere on screen. Ideally, hovering your mouse over a map part would display its name as a tool tip. Perhaps this can be fixed in a future version of iMindQ.
Even with this minor usability issue, iMindQ offers the best implementation of map parts I’ve seen in any mind mapping program.
Defining custom topic styles
The styles tab on the right side of iMindQ’s workspace enables you to quickly change the look of your entire mind map or selected topics, as well as create your own. As with map parts, a link at the bottom of the styles pane enables you to easily “roll your own.” Once again, the functionality here is among the best I’ve seen in any mind mapping program.
Customizable icon library
When I’m creating mind maps, I frequently get frustrated by the fact that some programs don’t have the type of icon or symbol I need to convey a certain look and feel. That’s why I appreciate iMindQ’s well-organized library pane, which makes it easy to search its visual elements, as well as add your own icons and markers.
Easy flow charts
I created a flow chart in iMindQ, and found the process to be fairly easy. To access the topic shapes you need to do this, you must click on the “shapes” category within the library sidebar. From there, you can select from folders of diagram, flowchart and geometric shapes. You can import your own, but they must be in the scalable vector graphic (SVG) format. This is necessary because a flowchart or topic shape needs to become bigger and smaller as needed; the SVG format enables the shape to do so without a loss in clarity or sharpness.
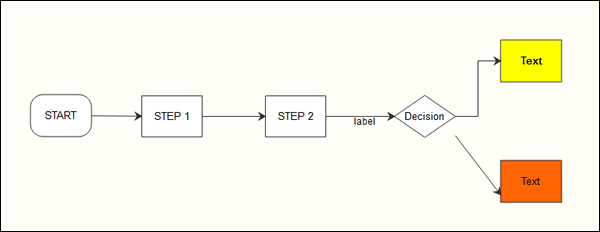
To create your flowchart, you simply drag and drop shapes into the workspace. As you drag successive shapes to create your flowchart, lining them up isn’t a problem, because iMindQ temporarily displays dashed red vertical and horizontal lines to show when shapes are perfectly aligned to each other. That saves a lot of time compared to some diagramming programs, where you are forced to manually align shapes.
Joining your flowchart elements with connector lines is simple as well: Just drag your mouse from the shape’s pop-up “quick menu” to the shape to which you want to connect it. More about the quick menu in a few minutes. By default, each of the connector lines is straight, but you can easily transform them into 90-degree lines using the program’s “relationship shape” command. Why “relationship?” Because the command that enables you to connect two topic together in a mind map does double duty as the shape connector when creating flow charts and other diagrams in iMindQ.
Adding a label to a connector line is as simple as selecting the connector and then typing it. It took me a little while to figure this out, because it wasn’t explained clearly in the program’s help file. But it is the simplest possible way to add this information to a connector line. I also noticed that when I selected a connector line, a format menu appeared with a purple tab in the ribbon toolbar – similar to the way that Microsoft Word displays context-sensitive toolbar tabs when you’re performing certain operations. This format tab revealed quite a few options for styling this line.
I like the fact that Seavus adopted this familiar, Microsoft Office-like way of handling this functionality: This formatting toolbar tab stays out of the way until it’s needed. When you’re ready, it appears, and enables you to refine your connector line to suit your needs.
Creating concept maps and other types of diagrams
Curiously, concept maps, flowcharts and other diagrams are all gathered under iMindQ’s whiteboard. But after using the program and creating several types of diagrams, it all makes more sense to me now: These types of diagrams all use shapes and connectors, but in different ways. So it actually does make sense to gather them all together.
Fast and easy organizational charts
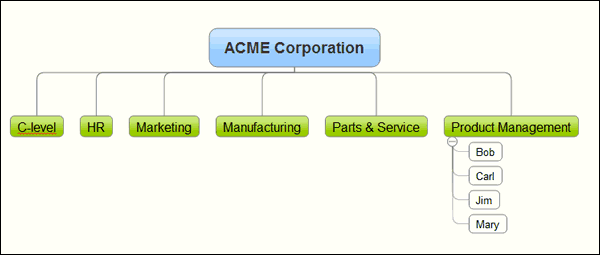
iMindQ enables you to make fast work of basic organizational charts. Selecting this option pre-loads the workspace with a topic called “organization.” From there, you can use the insert key to add departments. Below that level, iMindQ prompts you to enter employee names.
Like the diagram view, org charts have a special format menu all their own, which enables you to adjust topic spacing, shapes and more. I tried a number of different ways to add a second level of corporate structure to my sample mind map, I discovered that iMindQ currently only supports single-level org charts.
This is the first version of iMindQ; perhaps Seavus will add more functionality to this part of the program in future versions. For now, iMindQ offers of the fastest ways I’ve seen to create a simple org chart.
Project management
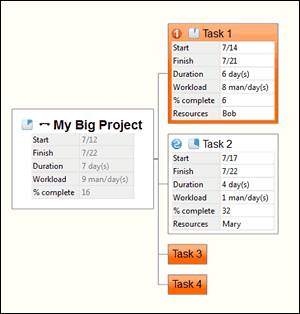 iMindQ enables you to create a project plan called a Work Breakdown Structure, or WBS. Essentially, you take your overall project and break it down into individual tasks. Task data is entered via the “Task Info” panel on the right side of the workspace. It enables you to define start and end dates for tasks, duration, estimated hours, resources, priority level and percentage complete, plus dependencies and constraints.
This is the first time I’ve ever seen the last two elements included in the task and project management capabilities of other mind mapping software programs. Another unique capability is a checkbox that enables you to show or hide task information in a topic. This enables you to simplify the view of your mind map – say, if you’re presenting it to a team of senior-level executives – but keep it available in the background for your own reference. Finally, you can designate a summary task, which rolls up the duration and work elements into summary totals.
One minor complaint: The percentage complete tool in the task info panel only enables you to show progress in 25% increments (e.g., 0%, 25%, 50%, and so forth). There may be cases where you want to show a more finite measurement of task progress, such as 15% or 65%. You can change these values in 1% increments in the program’s GANTT view, but not in this dialog box.
iMindQ’s Gantt view is well organized and attractive, with a slight 3D effect applied to the horizontal bars that depict start and end dates; embedded within these bands are smaller green lines that show actual progress, based upon the value you entered for percentage complete. Once again, very intuitive.
Both the GANTT task data and the chart are editable; in other words, within the chart view, you can drag and drop a duration bar for a task or its current percentage complete – nice! You can also right-click on a bar and select “task information,” which displays a dialog box containing all of the currently-selected task’s data.
Conclusion
If your needs for visual thinking and planning go beyond mind maps and you don’t want to purchase dedicated programs or some confusing high-end program with hundreds of possible ways to create and tweak your diagrams, then iMindQ is an excellent choice. It provides you with many tools and much flexibility to create exemplary mind maps and diagrams, but doesn’t overwhelm you with options. First-time users and experienced mind mappers will feel right at home with this well-designed and easy-to-use program.
A perpetual license for iMindQ for Windows is US$149; for Mac OS X, $99. One-year subscriptions are also available for $US67 and $45, respectively. Considering how much functionality iMindQ offers for the money, it’s an excellent value. A 15-day trial download is also available if you simply want to try out iMindQ.

Leave a Reply