
Are you a victim of technostress? The strain, anxiety, and fatigue caused by digital work demands have worsened since the advent of AI.
It doesn’t just add more information. It increases the rate at which information is produced, forwarded and “must-respond” processed. That pushes knowledge work toward a high-volume, high-interruption mode where attention becomes the bottleneck.
Simply put: AI has significantly accelerated the creation of information. But the human brain’s ability to make sense of information?
It hasn’t changed at all.
Ways AI is amplifying information overwhelm
AI increases the throughput of communication (more messages, faster cycles)
When drafting, summarizing and “first-pass thinking” become cheap, organizations tend to produce and circulate more memos, emails, decks and chat updates, often before clarity is achieved..
Microsoft’s data shows the pace of messaging is already intense: the average worker receives 117 emails/day and 153 Teams messages per weekday. Employees using Microsoft 365 are interrupted every ~2 minutes by a meeting, email or notification (Microsoft also quantifies this as 275 interruptions per day for the top 20% most-pinged users).
How does AI makes this worse? if AI helps people create and send “good enough” updates faster, the total number of pings that land on everyone else’s attention tends to rise, especially in chat-first organizations where responsiveness is culturally rewarded.

AI accelerates “always-on” work rhythms and erodes boundaries
AI tools reduce the friction of sending something now, asking for input now and iterating now. The result is more activity outside traditional hours and more fragmented focus time. Microsoft reports:
- 40% of people online at 6am are reviewing email for the day’s priorities.
- Chats outside 9–5 are up 15% year over year, with an average of 58 after-hours messages arriving per user.
- Meetings after 8pm are up 16% year over year.
In its Work Trend Index survey, 48% of employees (and 52% of leaders) say work feels chaotic and fragmented.
Why AI makes this worse: When “answering well” takes less effort, expectations shift subtly from “respond tomorrow” to “respond in the next hour,” and then to “why didn’t you respond instantly?” The burden lands on recipients as perpetual triage.
AI creates review and verification load (“looks right” does not equal “is right”)
Generative AI often outputs text and code that appears polished, which shifts work from creation to evaluation, which is cognitively expensive.
In software (a clear, measurable knowledge-work domain), Sonar’s 2026 survey finds:
- 96% of developers don’t fully trust AI-generated code to be functionally correct.
- 95% spend at least some effort reviewing/testing/correcting AI output; 59% call that effort “moderate” or “substantial.”
- 38% say reviewing AI-generated code takes more effort than reviewing colleagues’ code.
Why AI makes this worse beyond coding: the same pattern shows up in strategy docs, analysis, research summaries, and customer communications. AI generated Outputs proliferate, then humans must verify accuracy, context and implications.
AI increases “workslop”: extra volume that must be cleaned up
A nasty dynamic emerges when AI becomes a “speed layer” over messy workflows: more drafts, more versions, more half-right artifacts. In other words, it creates more to read, fix and reconcile.
Zapier surveyed 1,100 enterprise AI users and found:
- 58% spend 3+ hours/week revising or redoing AI outputs, even though 92% still say AI boosts productivity.
- It also reports an average of 4.5 hours/week cleaning up AI mistakes.
Why AI makes this worse: it can shift cognitive work downstream. One person saves 15 minutes generating something; five other people spend 10 minutes each deciphering, correcting or integrating it.
AI adoption is now widespread, so these effects scale quickly
Overwhelm doesn’t require 100% adoption; it compounds once enough people generate more content faster.
OpenAI’s enterprise report notes that in organizations using its tools, ChatGPT message volume grew 8× year-over-year (a proxy for how quickly AI-mediated communication and querying can scale internally).
Why this matters: Once AI becomes the default for drafting, summarizing and generating alternatives, the production side scales faster than the organization’s ability to absorb and decide.
How can visual thinking tools alleviate AI-enhanced information overload?
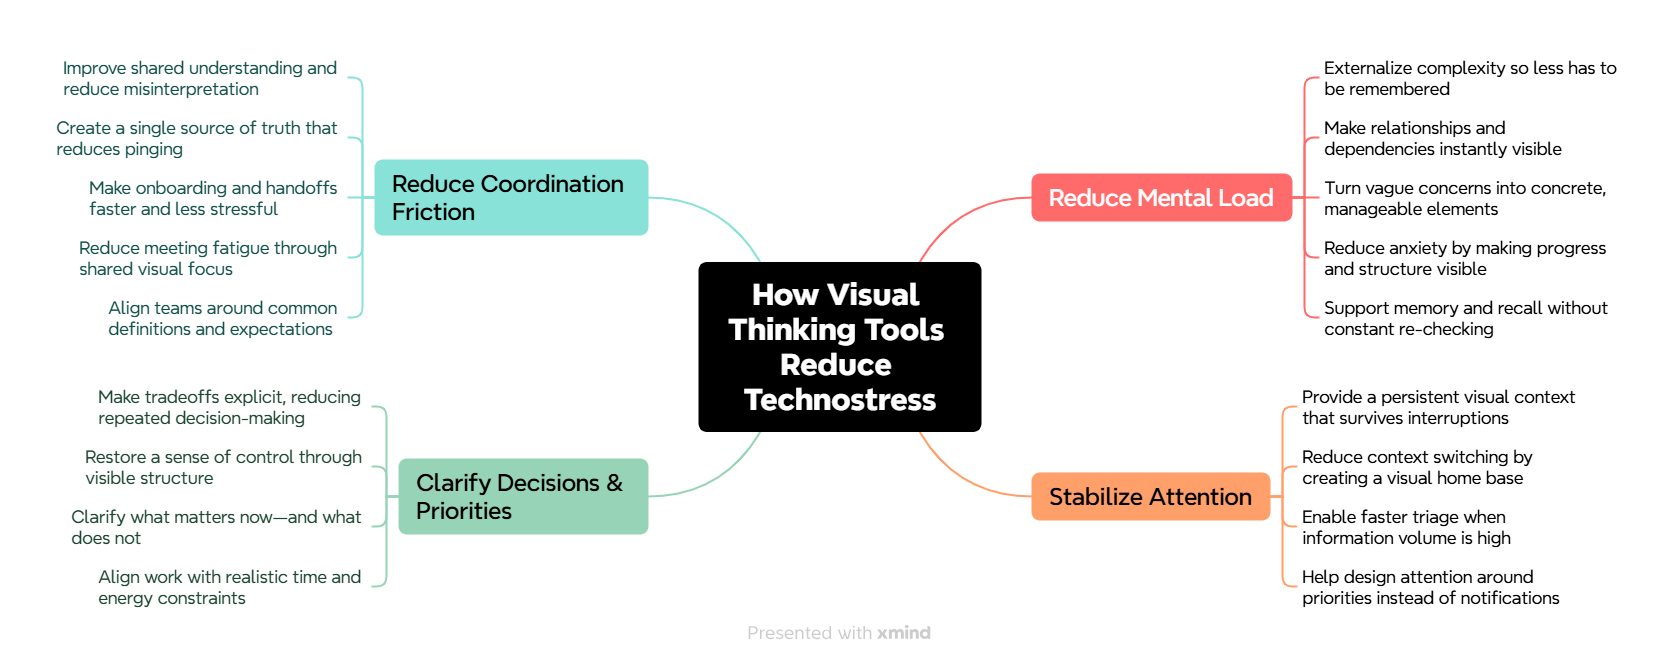
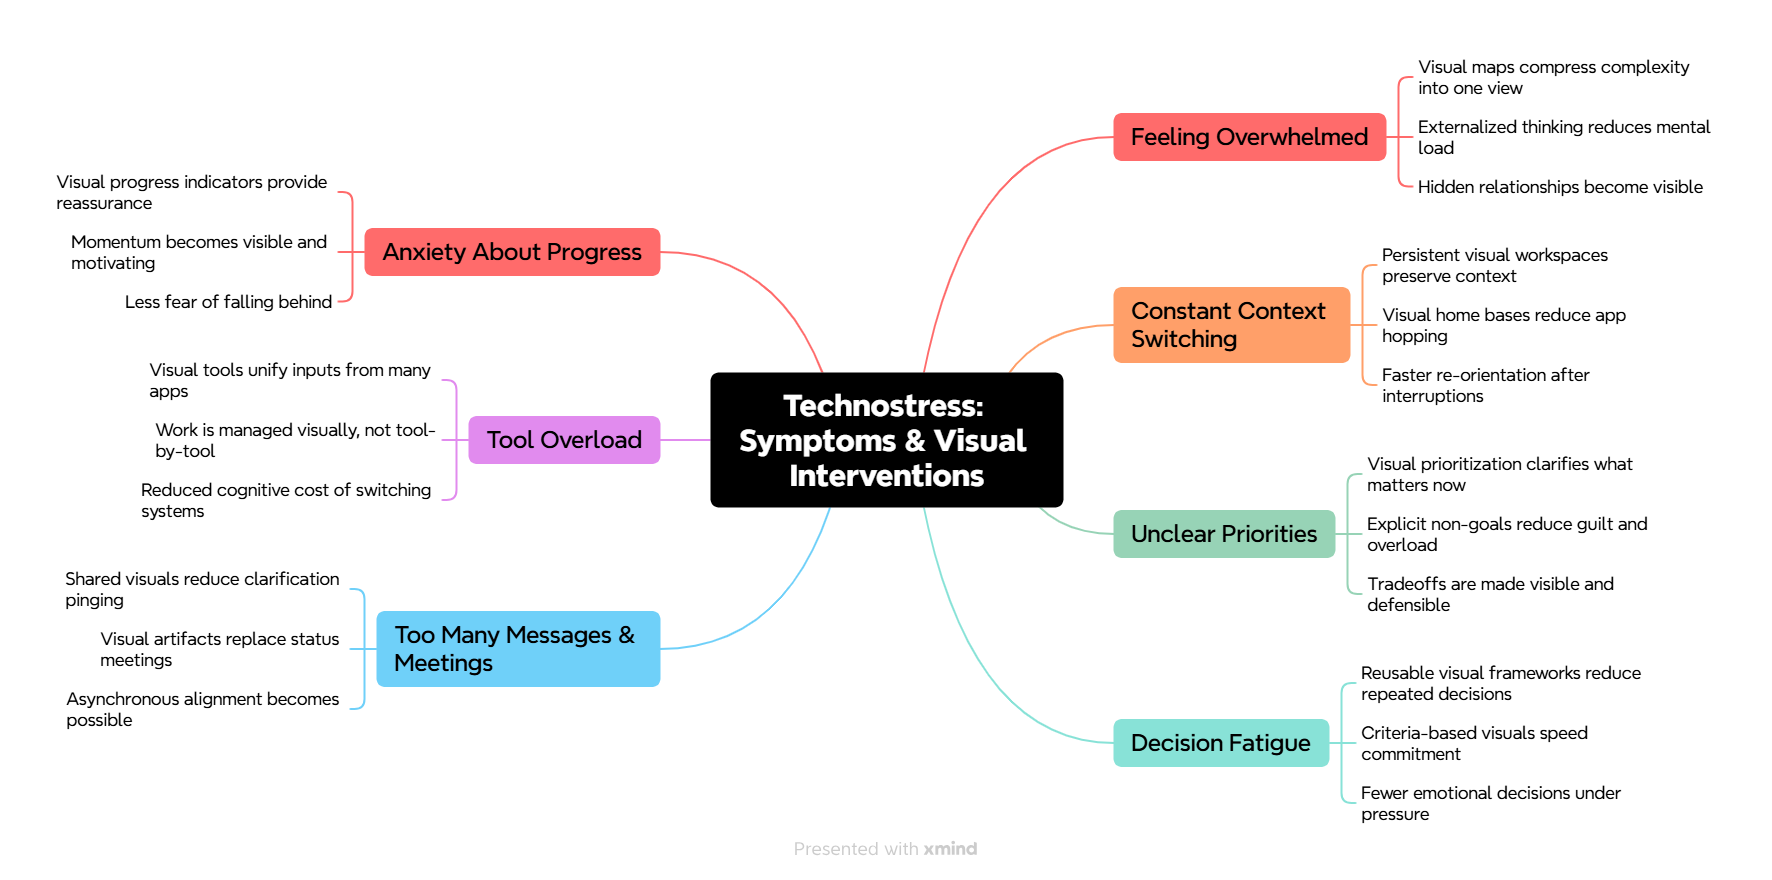
Here are the main ways visual thinking tools reduce AI-generated technostress:
- They compress complexity into a single, graspable picture: Technostress often comes from carrying too many moving parts in working memory. A visual model externalizes that load so you can see the whole system at once (and stop mentally juggling it).
- They restore a sense of control through structure: A major driver of technostress is feeling that work is coming at you (messages, tasks, alerts) rather than being owned by you. Visual tools impose structure: categories, relationships, priorities, dependencies.
- They reduce decision fatigue by making tradeoffs visible: Digital work produces constant micro-decisions (“what first?” “who needs this?” “what’s blocked?”). Visual prioritization (quadrants, swimlanes, constraint maps, impact/effort plots) makes the decision criteria explicit.
- They counter “context switching” by keeping context persistent: Technostress spikes when you bounce between apps, threads, and tabs. A visual workspace can become a “home base” where the essential context stays stable while details link out.
- They turn ambiguity into concrete next steps: Ambiguity is stressful. Visual tools break fuzzy problems into parts: goals, stakeholders, constraints, assumptions, risks, and actions.
- They make hidden relationships and dependencies obvious: A lot of stress comes from surprises: “I didn’t realize that depended on this.” Mapping relationships (causal loops, dependency trees, system maps) surfaces what’s connected and what isn’t.
- They provide a “single source of truth” that reduces pinging: When information is scattered, people ask repeatedly (“Where is that?” “What’s the latest?”). A visual hub—project map, decision map, process diagram—can answer questions without another message.
- They improve communication bandwidth and reduce misinterpretation: Text is easy to misread. Visuals clarify intent: sequence, ownership, boundaries, and meaning. Shared diagrams prevent people from talking past each other.
- They reduce the stress of “tool overload” by becoming tool-agnostic: Many visual tools can integrate inputs from multiple apps (links, embeds, cards) without forcing you to live inside each one. Even without integration, a visual index can unify scattered resources.
- They help you triage faster when work volume is high: When you’re overwhelmed, you don’t need more information—you need a way to sort it. Visual triage boards (Kanban, pipeline, inbox-to-map, cluster maps) help you rapidly categorize what matters.
- They make progress visible, which reduces anxiety: Technostress often includes the feeling of “I’m working all day but nothing is done.” Visual progress indicators (done lanes, milestones, burn-up snapshots, roadmap views) give your brain evidence of forward motion.
- They support “cognitive offloading” and memory support: Visual notes, sketchnotes, and maps act as extended memory. This reduces fear of forgetting and the constant need to re-check.
- They create smoother onboarding and handoffs: Technostress rises when you inherit a project with no coherent explanation. Visual documentation—process maps, architecture diagrams, decision logs—reduces the pain of catching up.
- They enable better boundaries and “attention design”: You can design a visual workspace to reflect what you want your attention to do: a daily map, weekly dashboard, “parking lot” for distractions, and a limited set of active priorities.
To summarize, Visual thinking tools alleviate technostress by reducing:
- Cognitive load (externalize complexity),
- Coordination load (shared clarity),
- Decision load (visible priorities/tradeoffs),
- Attention load (stable context and fewer pings).
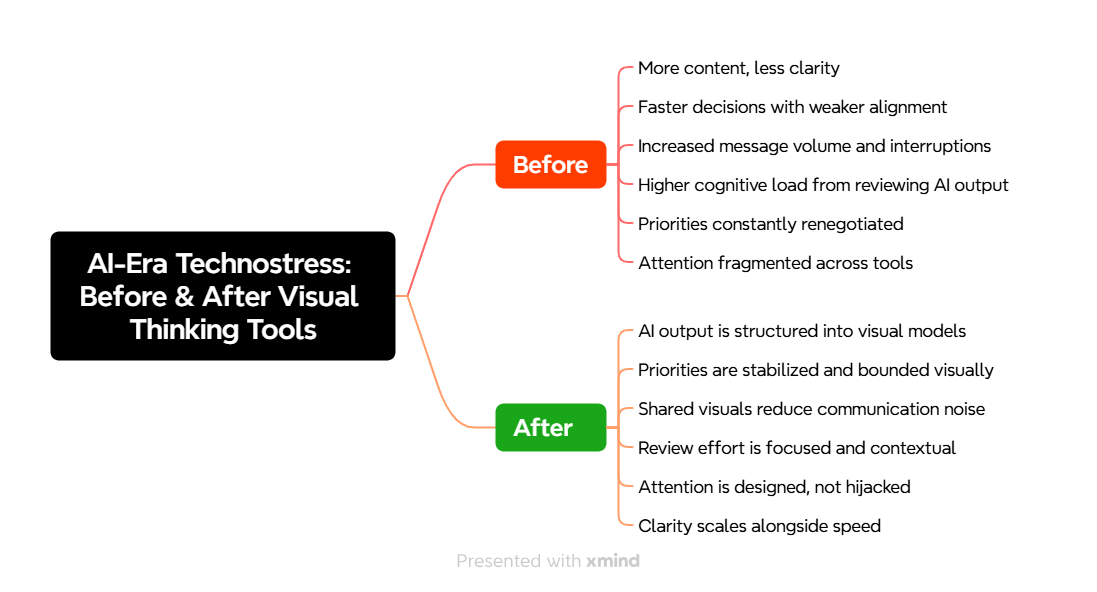
Here’s what this looks like in a before and after mind map. It will help you clearly see the difference visual thinking tools can make in your work:
Which types of visual thinking tools can help you?
Which tools are best for you, based on the technostresses you’re facing?
Download the Visual Thinking Tool Prescription Worksheet (It’s free. No registration is required.).
This fillable PDF form will help you diagnose your dominant technostress and select visual thinking tools that will restore clarity, focus, and momentum in your work.
You can also read my new Ultimate Guide to Visual Thinking Tools book.
Leave a Reply