

If you’ve been curious about my new book The Ultimate Guide to Visual Thinking Tools but still have questions before diving in, you’ve come to the right place. Here are the most common questions I hear from professionals, executives, and creators, along with candid answers drawn directly from the guide’s content and from 18 years of personal experience with these tools.
Q: What exactly is this guide, and who is it for?
The Ultimate Guide to Visual Thinking Tools is a 62-page comprehensive resource that maps 15 categories of visual thinking tools to over 42 real-world business applications. It’s written for busy executives, entrepreneurs, project managers, marketers, researchers, and content creators who feel overwhelmed by information and under-equipped with the tools they’re using.
If you’ve ever stared at an endless Google Doc, struggled to communicate a complex idea in a meeting, or wondered why your presentations aren’t landing the way you hoped, this guide was written specifically for you.
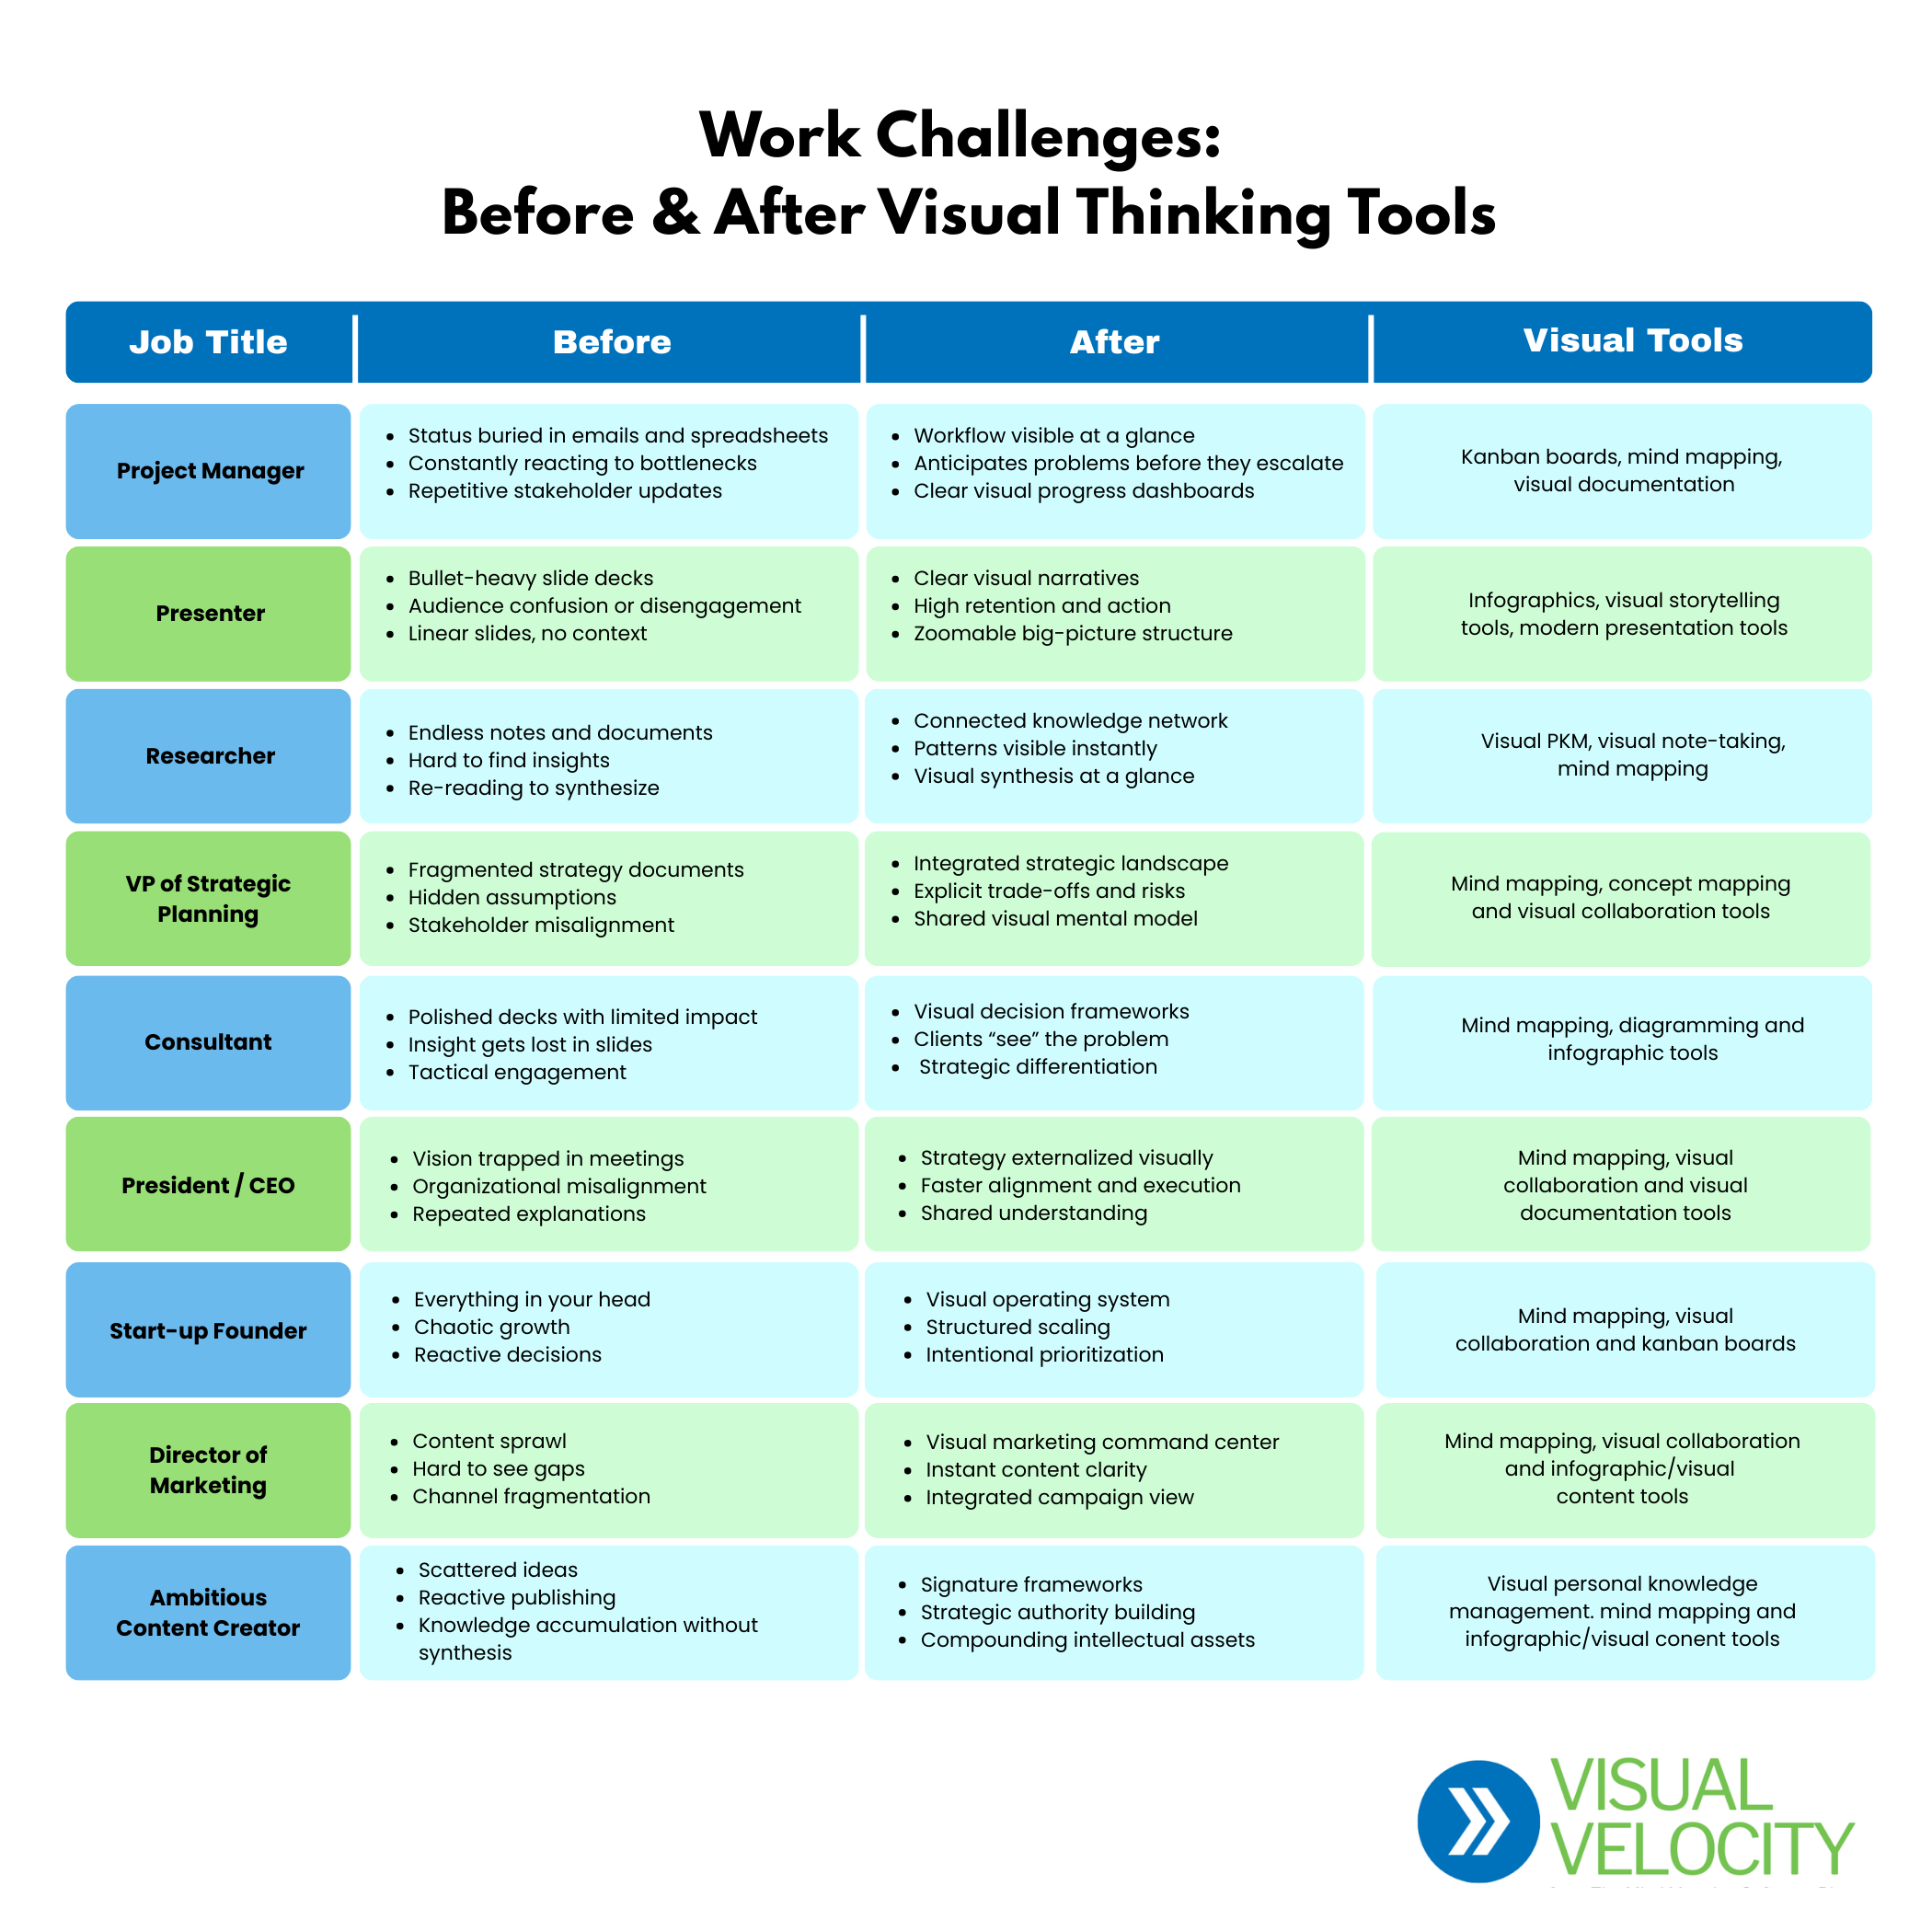
The new chart below outlines nine types of jobs, the types of challenges managing information they typically face, what their world looks like after visual thinking and the types of tools that are best suited to their needs (click image to view a larger version).
Q: Why do I need visual thinking tools? Aren’t documents and slides good enough?
Documents and slides are what the guide calls “the ultimate expression of linear thinking.” You can only view one page at a time, which hides the structure of your ideas and makes it nearly impossible to spot connections between related concepts.
“Documents and presentations are the ultimate expression of linear thinking. They’re created and consumed in sequential order… It’s like wearing blinders.” — The Ultimate Guide to Visual Thinking Tools
In today’s environment, where the average knowledge worker consumes the equivalent of 174 newspapers worth of information every day, linear tools can actually make the problem of information overload worse. Visual thinking tools help you see patterns, make connections and communicate complex ideas with clarity in ways that documents simply can’t.
Q: How does AI make this problem even worse?
AI tools like ChatGPT can generate research, summaries, and content in seconds that would have taken hours or days to gather manually. That sounds like a superpower — and it can be — but it floods you with even more text-based information to process.
The guide makes the argument that AI magnifies the need for visual thinking tools rather than replacing them. When AI can produce mountains of content, the professionals who stand out are those who can organize, synthesize, and communicate that information visually. That’s a skill AI can’t replace.
Q: You say in the book that visual thinking has a “dark side”? What do you mean?
This is one of the most thought-provoking chapters in the guide and one that sets it apart from anything else you’ll find on this topic.
The core insight: visual thinking doesn’t automatically create clarity. It amplifies whatever thinking you bring to it. A beautifully organized mind map built on rushed, biased, or incomplete thinking isn’t an insight. It’s what the guide calls “beautifully organized confusion.”
The guide walks through several traps to watch for, including:
- The Illusion of Clarity: A polished visual can feel finished even when the underlying logic is fragile.
- When Structure Becomes Truth: The first map you draw tends to stick, even when it shouldn’t.
- Over-Mapping as Avoidance: Adding more nodes and connections while postponing decisions.
- Performative Visuals: Diagrams created to look intelligent rather than create genuine understanding.
The antidote, according to the guide, is treating visuals as hypotheses rather than answers, and deliberately asking: “What’s missing? What doesn’t fit? What assumptions am I making?”
Q: What are the 15 types of visual thinking tools covered?
The guide profiles each of the following tool categories with detailed overviews, recommended applications, advantages, disadvantages, and specific software recommendations:
- Mind Mapping: The most well-known category; great for brainstorming, project planning, and knowledge organization
- Concept Mapping: Shows complex, non-hierarchical relationships between ideas
- Diagramming: Standardized visuals for process flows, org charts, and system architecture.
- Visual Collaboration: Infinite-canvas platforms like Miro for remote brainstorming and workshops.
- Visual Note-Taking: Combines sketches, diagrams, and multimedia to improve retention and recall.
- Infographics: Transforms data and complex information into compelling, shareable graphics.
- Visual Documentation: Knowledge bases that blend text, images, and diagrams.
- Visual PKM (Personal Knowledge Management): Networked notes that treat knowledge as a living system.
- Online Graphics: Accessible design tools like Canva for marketing and social content.
- Data Visualization: Turns raw data into charts, dashboards, and interactive displays.
- Kanban Boards: Workflow management to track projects and spot bottlenecks.
- Visual Storytelling: Narratives that combine text, images, and interactivity for higher engagement.
- Systems Mapping : Visualizes complex interdependencies within organizations or ecosystems.
- Presentations: Modern tools that go beyond bullet-heavy slides.
- Visual AI: AI-powered tools that generate and structure visual thinking from natural language inputs
Q: How do I know which tool is right for me?
This is exactly what Chapter 6 (“Selecting the Right Tool for Your Needs”) and the Visual Thinking Tool Selection Matrix are designed to answer.
The guide recommends starting with the “jobs to be done.” What information gathering, analysis, synthesis, and presentation tasks do you regularly perform? From there, the selection matrix maps 42 common business applications to the most relevant tool categories, so you can zero in on the 2–3 tools most likely to transform your workflow.
The guide also walks through day-in-the-life scenarios for two different roles. a researcher and a director of marketing, to show how different professionals build different visual thinking stacks.
Q: How many specific tools are recommended inside?
The guide recommends 83 specific tools across all 15 categories, including both free and paid options in each category. This means you won’t have to guess where to start. You’ll have a curated shortlist vetted from 18 years of hands-on experience.
For example, in the Mind Mapping category alone, free options include XMind and GitMind, while paid options include MindManager, iMindQ, MindView, and Ayoa. Each recommendation comes with a brief description of what makes it stand out.
Q: I’m not a creative person. Is this still for me?
Absolutely. The guide makes this point clearly: Visual thinking isn’t about being artistic. McKinsey consultants use visual frameworks. Military leaders use visual strategy maps. Engineers use visual system diagrams. These are some of the most analytical, results-driven professionals in the world.
Visual thinking is about being effective in a complex world, not about making pretty pictures. The tools profiled in the guide are designed to be used by people who work with information, not graphic designers.
Q: What are some real-world examples of visual thinking tools in action?
Chapter 5 shares three compelling case studies from the author’s own career:
- An interactive editorial opportunity plan: After a media day packed with trade magazine meetings, the author organized dozens of editorial opportunities into a comprehensive mind map and presented it to his client, branch-by-branch. The client was so impressed they requested the same format the following year.
- A visual content planning dashboard: Using Miro, the author built a board for an industrial marketing client that showed existing blog content and idea gaps across seven topic areas at a glance. The client loved the clarity it provided.
- An interactive career timeline: Built in Visme with clickable pop-ups revealing work samples. The result: landing a dream job as a content strategist at a major contract manufacturer.
Each example illustrates how visual thinking tools can differentiate your work and impress the people who matter.
Q: I don’t have time to learn a bunch of new tools. Will this be overwhelming?
The guide was written with exactly this concern in mind. The recommendation is simple: don’t try to learn every visual thinking tool. Build your personal visual thinking stack — the 2 or 3 tools that match your specific goals and work style.
Chapter 8 offers a practical three-step getting started framework:
- Pick one tool and use it today. Not tomorrow, not “when things slow down.” Start messy. Start small. Just start.
- Bring one visual element into your next piece of communication, such as a diagram instead of a paragraph, a mind map instead of a bulleted agenda.
- Build a personal visual thinking stack over time. Mix and match as you get comfortable.
Most readers report implementing their first tool in under 30 minutes. The selection matrix dramatically shortens the learning curve by pointing you directly to the tools most relevant to your work.
Q: How is this different from a typical software review roundup?
This guide was written by a practitioner with 18 years of daily experience using visual thinking tools, not a generalist writer churning out listicles based on marketing copy. I have tested and reviewed over 100 visual thinking tools, published more than 500 in-depth articles, and helped more than 50,000 professionals navigate this space.
The guide doesn’t just list tools. It helps you understand the theory behind visual thinking, the hidden pitfalls to avoid, and a decision framework for selecting the right tool for your specific situation. The inclusion of the “dark side” chapter alone demonstrates the depth and candor of the thinking behind it.
Q: Is there a guarantee?
Yes. The guide comes with what the author calls an “Applied Knowledge Guarantee”: Get the guide, implement one tool recommendation and if you don’t save at least two hours in your first week, you can request a full refund and keep the guide anyway.
The author takes all the risk because he’s confident in the practical, actionable nature of the content.
Q. Why is visual thinking no longer optional?
The most successful leaders and organizations have already made the shift to visual thinking. They understand that in a world where attention is scarce and complexity is high, the ability to think and communicate visually isn’t just an advantage—it’s a necessity.
The bottom line is that visual thinking tools can help you differentiate your work and help you contribute at a higher, more creative, more strategic level. They’re a catalyst that can help you accelerate your career or your business.
Q: What’s the single most important takeaway from this guide?
Perhaps the most powerful idea in the guide is this: in a world where AI can generate unlimited content, clarity becomes the new competitive currency. The professionals who thrive are those who can make sense of complexity and communicate with undeniable impact — and that requires better thinking tools, not just better time management.
“Visual thinking tools can help you differentiate your work and help you contribute at a higher, more creative, more strategic level. They’re a catalyst that can help you accelerate your career or your business.”
The question, as the guide puts it, isn’t whether you should adopt visual thinking tools.
It’s which ones will serve your specific needs best.
Are you ready to go visual?
Get your copy of The Ultimate Guide to Visual thinking Tools now
Leave a Reply