
Want to show a sense of purpose or direction in your mind maps? Then consider creating a “compass map” like this one, inspired by a new nutritional information program launched by global food giant Nestlé.
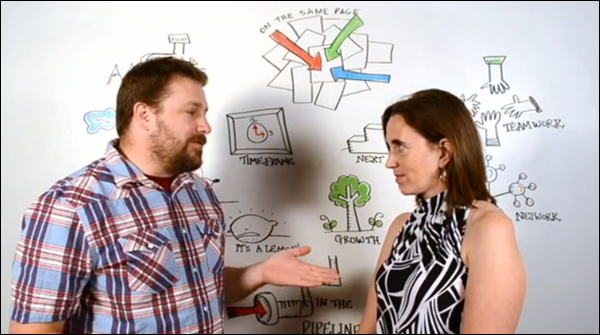
Sketchnoting: A closer look with its developer, Mike Rohde
Listen to my podcast with Mike Rohde, author of The Sketchbook Handbook. We discuss the thinking behind sketchnoting, why visual thinking is valuable today and creating sketchnotes on tablets.
20 powerful business uses of graphic recording and facilitation
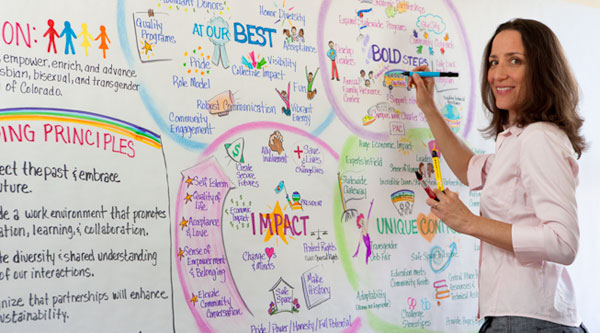
Graphic facilitation – drawing out a challenge, situation or process on a whiteboard with simple shapes – is a powerful tool to help teams get things done. Here are 20 powerful business uses of it.
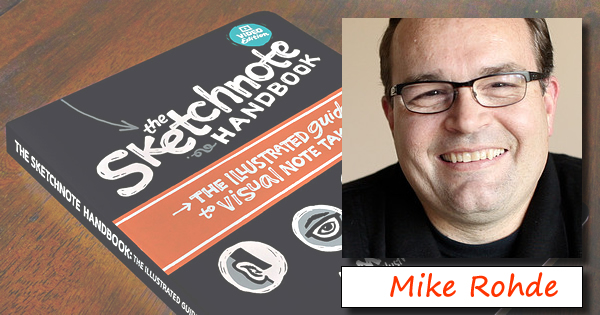
The Sketchnote Handbook: A brilliant new guide to visual note taking
The Sketchbook Handbook: The Illustrated Guide to Visual Note Taking by Mike Rohde was launched last week. This terrific new book is an essential guide to this relatively new branch of visual thinking.
Become a Rockstar Scribe: Awesome e-course teaches essential graphic recording skills
Become a Rockstar Scribe is a terrific a new online video course that teaches you how to become a more fluent visual thinker and graphic recorder. If you’re interested in becoming a better visual thinker, I highly recommend it.
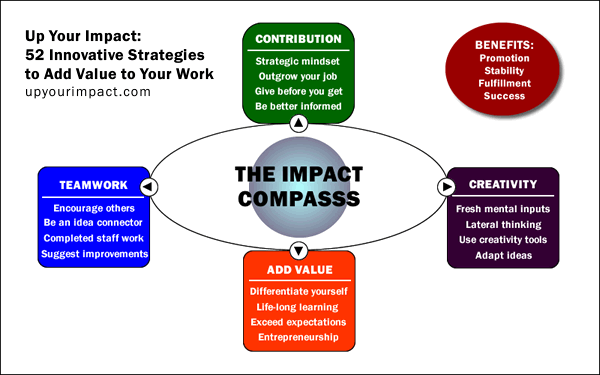
The Impact Equation: A visual assessment tool
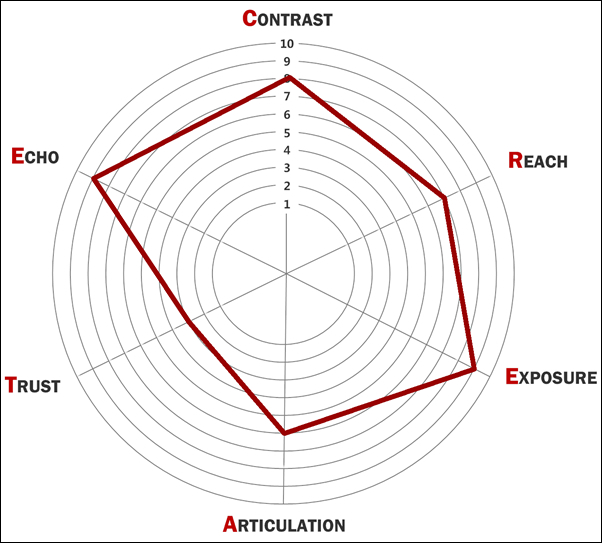
To help readers of The Impact Equation to assess their current level of progress, I created a helpful “radar chart” diagram.
Diagrammer offers 4,000 business diagrams – for only 99 cents each
Nancy Duarte, visual thinking book author and consultant, earlier this week launched Diagrammer, a searchable database of 4,000 business diagram templates that you can purchase and download for only 99 cents each.
How to avoid “death by detail”
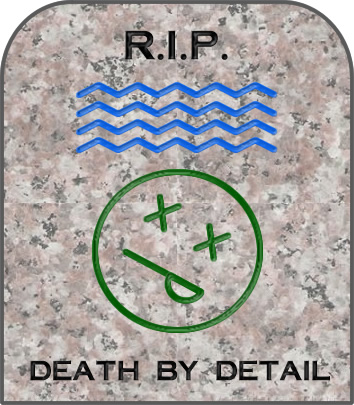
Dan Roam’s new book explores visual techniques for helping us to bring greater clarity and impact to our communications – and to avoid “death by detail.”
Visualize.me: Picture your resume as a kick-ass infographic
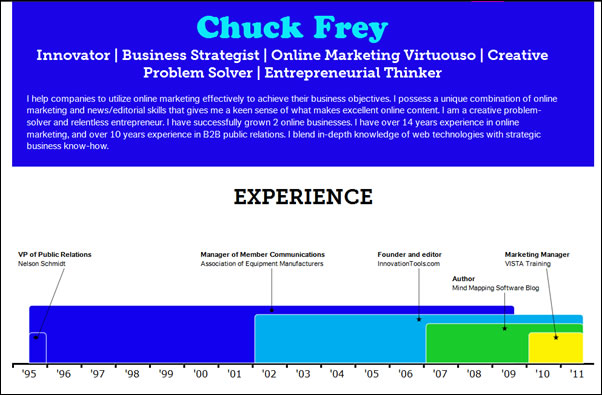
An impressive new web-based application called Visualize.me automatically converts your Linkedin profile into a colorful infographic. Its developers hope it will revolutionize the resume, replacing the boring, text-based skills summary with a colorful visual representation of your career.
A snapshot of business use of mind mapping software (infographic)
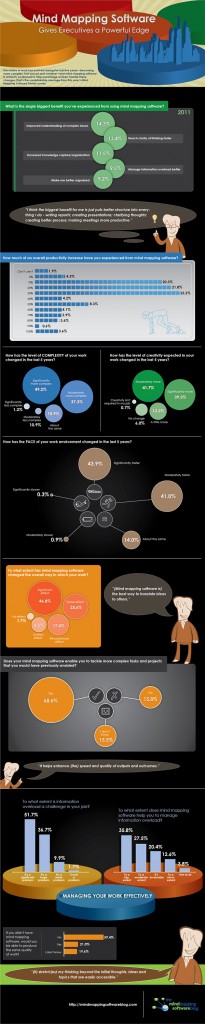
A new infographic provides a valuable snapshot of the use of mind mapping software in business.
- « Previous Page
- 1
- …
- 5
- 6
- 7
- 8
- 9
- Next Page »